Health as a form of overcompensation for the carbon footprint of cycling

Surprisingly, the carbon footprint of cycling can be up to six times higher than that of a train. Since cycling has health benefits, it is relevant to determine the influence of health on the carbon footprint of cycling.
By Pierre-Emmanuel GUILHEMSANS-VENDÉ, R&D Consultant at TNP Consultants (1.1 tons of CO2e offset by cycling since September 2021)
Is the train the least polluting mode of transport in France?
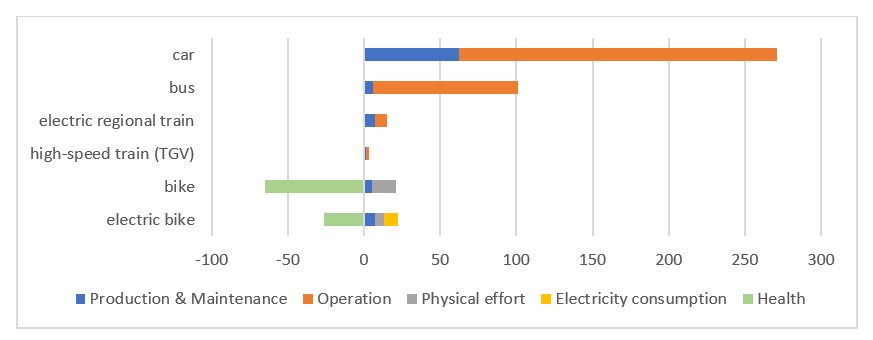
In France, it is commonly accepted that the least polluting mode of transport is the train. Benefiting from a low-carbon electrical energy mix, thanks to nuclear energy, electric trains will emit over their entire life cycle, in the case of a high-speed TGV train, 3.3 g CO2e.passenger-1.km-1 and 15.3 g CO2e.passenger-1.km-1 for an electric-powered, local TER train [1], [2]. Compared to the car, which emits 271 g CO2e.passenger-1.km-1 over its entire life cycle, and the bus, which emits 101 g CO2e.passenger-1.km-1 [3], the environmental balance is clearly in favor of the train and its development. However, whether for passenger or freight transport, France is far behind its European neighbors. For example, Switzerland runs three to four times more trains per day on each of its lines than France, both for passenger and freight transport (130 compared to 38 for passengers and 24 compared to 7 for freight). Moreover, Italy invests twice as much per capita as France in its rail infrastructure (Switzerland 9 times). There is therefore a real challenge for rail in France.

Figure 1 – Comparison of emissions from different modes of transport over their life cycle
Bicycles, more polluting than trains?
Another mode of mobility also needs to be developed in France, by giving it more lanes and more safety in public spaces: the bicycle. This mode of soft mobility has made great progress over the last 20 years in major cities (+60%), but France is also lagging on the subject, just as it is for the train. The modal share of cycling in France is 2.7%, whereas the European average is 9%! [4] In June 2019, the Loi d’Orientation sur les Mobilités (Mobility Orientation Law) included the objective of increasing the modal share of cycling to 9% by 2024 and 12% by 2030. This requires a very proactive policy with substantial investment. Thus, to achieve a 9% modal share, it would be necessary to add 100,000 km of cycling facilities to the 45,500 km already existing in 2020 and to invest at least €30 per year per inhabitant (by way of comparison, investments are €271/year/inhabitant for the car and €473/year/inhabitant for public transport) instead of €8.70/year/inhabitant, as in 2019. In addition, the typical cycle network in large French cities is dense but very discontinuous, which leads to decreased safety on non-cycling sections and partly explains the stagnation of the modal share of cycling. To sum up, a tripling of the modal share requires a tripling of expenditure and infrastructure and a continuous, meshed cycle network.
This expenditure and commitment to cycling is necessary because it will bring economic, environmental, health and well-being benefits to users. For example, in economic terms, cycle tourism brings in €4.2 billion for the State, bearing in mind that this type of tourist spends more than other tourists (€68/day compared with €55/day, on average). From a health point of view, cycling for 30 minutes a day can halve the risk of stroke. Finally, from an environmental point of view, cycling is one of the lowest carbon modes of transport, with an emission factor of 21 g CO2e.passenger-1.km-1 (mechanical bike) or 22 g CO2e.passenger-1.km-1 (electric bike) [3].
It seems counter-intuitive that cycling is a more polluting mode of transport than rail. It can be argued that amortization is done with the large volume of passengers using the train and a long-life span (30 years) over which a train travels long distances (450,000 km/year). Nevertheless, it is difficult to see how rail infrastructure and train manufacturing can have less of an impact on the environment than using a bicycle. Moreover, cycling undoubtedly has health benefits [5], [6], which no other mode of transport (including rail) has: yet health does not appear in the emissions balance of cycling. This article proposes to determine the carbon footprint of cycling-related health.
Carbon footprint of cycling-related health
According to the Inddigo and Vertigolab report of April 2020 [4] on the development of cycling in France, the economic impact of cycling corresponds to 2% of the consumption of medical care and goods. If the modal share were 9%, this impact would be 6%, and in the report’s most optimistic scenario, where the modal share is 23.7%, the economic impact would be 15% of healthcare expenditure! For all scenarios, the impact corresponds to an average value of €0.69/km.
However, according to a 2019 report by Health Care Without Harm and Arup [7], spending €1 million on health in France generates 93.8 t CO2e. Taking into account the economic impact value of €0.69/km, this means that cycling allows for a compensation and even an overcompensation of 64.7 g CO2e/km for a mechanical bike. Thus, for a mechanical or muscular bicycle, health enables the carbon footprint of 21 g CO2e.passenger-1.km-1 to be offset by a factor of three. For electric bicycles, it is assumed that the energy expenditure between 4.4 kcal/km and 11 kcal/km has a linear relationship with the health gain: this assumption is probably open to criticism in the case of a cyclist who uses his or her electric bicycle intensively (> 4,000 km/year). Under this assumption, we can deduce that the carbon compensation for health for electric bicycles is 25.9 g CO2e/km, i.e., slightly more than the carbon footprint of 22 g CO2e.passenger-1.km-1.

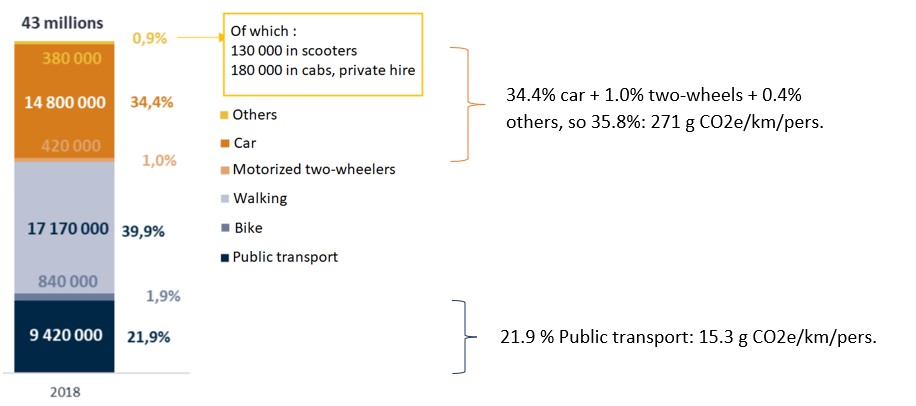
Figure 2 – Travel modes in Ile de France & Carbon footprint of a non-cyclist
The reasoning on the carbon offsetting provided by cycling can be taken even further based on the modal shift generated. In this way, we place ourselves in the most unfavorable conditions in terms of modal shift towards cycling, i.e. the Ile de France region where the modal share of combustion vehicles (cars, motorized two-wheeled vehicles, vehicles for hire, taxis) is the lowest in France, to the benefit of walking, cycling, scooters and public transport. In this case, the average final carbon footprint of a person living in the Ile-de-France region who does not use a bicycle and does not walk much would be 100.4 g CO2e/km (assuming a 35.8% modal share for combustion vehicles at 271 g CO2e/km/person, and 21.9% for public transport, at 15.3 g CO2e/km/person). Switching to cycling would therefore make it possible to avoid 144.1 g CO2e/km with a mechanical bicycle (or 104.3 g CO2e/km for an electric bicycle).
In conclusion, the development of cycling is a necessity because it increases the attractiveness of France for tourists, reduces health costs, and improves the well-being of its users. In addition, the carbon footprint of this mode of transport becomes negative if we consider the overcompensation linked to health. Coupled with a monitoring and health application, the bicycle could even become a means of rehabilitating people with disabilities: this is the challenge for a demonstrator developed within the LAAS-CNRS lab in Toulouse, as part of a thesis project currently being finalized [8] and in search of industrialization partnerships. According to Prof. Georges Soto-Romero, researcher at LAAS-CNRS, synergies could be found with associations such as ADEME, or companies that are positioned in this niche (VUF, eBikeLabs, MidiPile, Citix, Urbaner…), or even large-scale vehicle manufacturers and medical device manufacturers, such as a PSA/Ihealth or Medtronic alliance, or their top-tier subcontractors (Valéo/Actia…). However, cycling is still little considered and valued within business. The Mobility Plan and the Sustainable Mobility Package (FMD) do exist today, but it should be possible to go further, by encouraging cycling, via the creation of health carbon credits and the reintroduction of the kilometer-based package in addition to the FMD, this time without a ceiling for work-related journeys, and that the FMD can also benefit public sector employees. In addition, there is a real need for massive development of infrastructure and equipment (for example, 1 km of cycle track built for every 1 km of road), in addition to ensuring that users have safety, comfort and autonomy (in the case of electric bicycles) that are equivalent to current cars.
Sources
[1] “Site Bilans GES,” ADEME.
[2] Sétra, “Transport et Gaz à effet de serre (GES): Analyse des outils et méthodes utilisés pour quantifier les émissions de GES dans les projets d’infrastructures selon les différents modes de transport.” Dec. 2013.
[3] European Cyclists’ Federation (ECF), “Quantifying CO2 Savings of Cycling.” 2011.
[4] Inddigo and Vertigolab, “Impact économique et potentiel de développement des usages du vélo en France.” Apr. 2020.
[5] E. G. Avina-Bravo, J. Cassirame, C. Escriba, P. Acco, J.-Y. Fourniols, and G. Soto-Romero, “Smart Electrically Assisted Bicycles as Health Monitoring Systems: A Review,” Sensors, vol. 22, no. 2, 2022.
[6] P. Oja et al., “Health Benefits of Cycling: A Systematic Review,” Scandinavian Journal of Medicine & Science in Sports, vol. 21, no. 4, pp. 496–509, Aug. 2011.
[7] Health Care Without Harm and Arup, “Health Care’s Climate Footprint: How the Health sector contributes to the global climate crisis and opportunities for action – Appendix A: Tabulated national health care emissions for the 43 WIOD countries.” 2019.
[8] E. G. Avina-Bravo, “Conception, Développement et validation d’un système intelligent embarqué de mesure physiologique et biomécanique : vélo à assistance électrique avec IA à usage thérapeutique et de prévention santé,” LAAS-CNRS, 2023.

